As baseline we should identify what are the emissions at the baseline (2020). World Population Review (link) can give an idea on how this is distributed across the globe, also got the point you need to measure CO2 mt/p (metric tonne per capita).

It is really interested to see the impact of YOURSELF into this challenge.
If you are interested in the historical series you can also read Our World in Data (link) where also data per capita are available.
They specify very clearly the source: the Global Carbon Project (link).
Another good resource for these data is Statista (link)
Another important information is HOW this CO2 is produced.
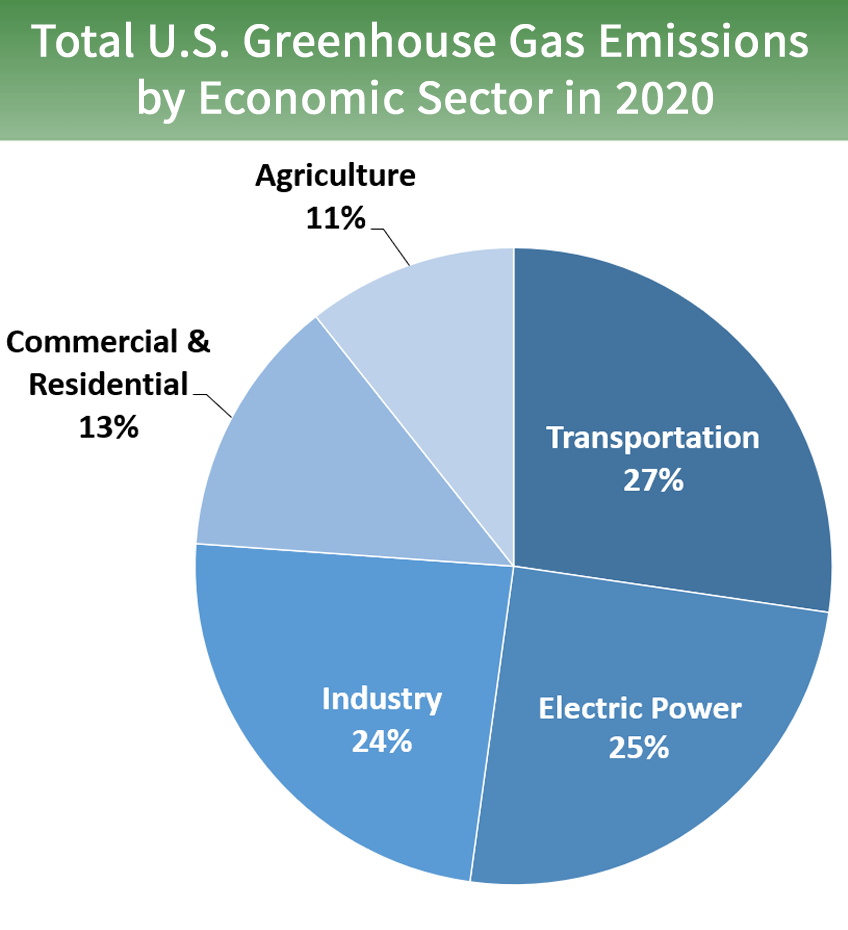
I have seen many model, but the my favourite is the one from EPA (US Environment Protection Agency) (link).
This model shows 5 main sources of CO2 in: Mobility, Electricity, Industry, City, Agriculture.

I have adapted the terminology to a simpler one, but this model is simple to visualize and also can be easily adopted in a game simulation.
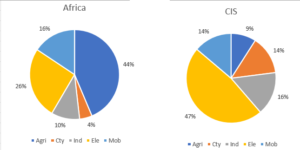
What I have done is looking for these data, per countries and, using the geography of the areas, aggregate them to have this information per area.
The source for this information is available on the web, with data of 2019 (not 2020, but this is the best I have found).
The result is very interesting because it confirms each region actually has a different pattern. See below image as an example

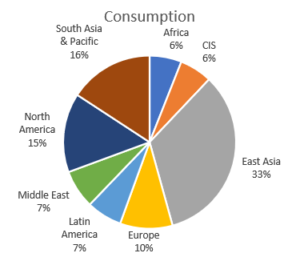
Using the same source, we can also estimate (or better calculate) the global emissions and we can distinguish the contribution from the different areas. This information, and confirmation, is really interesting and will have a significative impact on the dynamic of the game.

Now we are able to identify some key principles we need to consider in the game dynamic:
- There are 5 main sources of GHG: Mobility, Electricity, Industry, City, Agriculture
- GHG emissions (total and distribution per country and sources) are calculated with this model
- We need to research solutions in those areas to reduce GHG emissions with green solution with the same CO2e